by Jaclyn Kellner – Coastal Roots Farm – Encinitas, CA
Parashat Pinchas
“Take a census of all the congregation of the children of Israel from twenty years old and upwards, following their fathers’ houses…” From here, this week’s parsha, Parshat Pinchas, continues to list out the data from this census for the next 46 verses. There is a concept in Torah study that there is not a single superfluous word. This is also far from the only census recounted in full in the Torah. I am sure I’m not alone when I say that I often skim over this sort of census data, eager to get to a story, a list of laws, or a description of what life was like in biblical times.
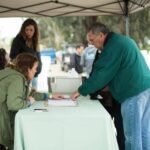
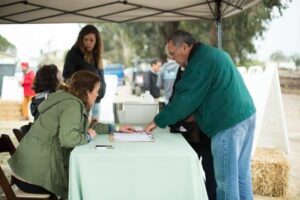
Data collection and analysis is probably among the least sexy work that nonprofits do. So much time and care is put into designing surveys that many folks then don’t fill out, countless hours are spent entering data from sign in and waiver forms. I often stop during a farm-to-fork type trip to weigh and track the produce before we prepare a tasty snack. After all of this work, it’s the information from those one-sentence testimonies, the pictures and hearing from folks face-to-face that seem to be the ‘stickiest,’ the information that people remember best. Just as I find myself skimming through census data in this week’s parsha, I find myself skimming through reports to quotes from customers, volunteers and community members like: ““Words can’t describe how appreciative we are of you all. Our Wednesday mornings have been super meaningful and full of hard work, new experiences, laughs, and the best people around! I hope we can volunteer in the food forest for years to come.” – Teacher in Adult Transition Program, Oceanside Unified School District.
Maybe it’s just part of human nature, or how we were conditioned, to focus on the intimate story, picture, experience or feeling. Which is not to say that all of that qualitative information is not important, because it is in fact incredibly important.
Quantitative data provides specificity: how many pounds of produce we donated to which distribution partner, how many people came to volunteer hours after attending a tour, what is the return rate for festivals. Yes, it is important information to keep for grants and donors. It is also an incredibly useful tool for self-reflection and evaluation within any organization.
Quantitative data, (while impacted by other biases based on question wording, unrepresentative sampling, etc) is not clouded by expectations or a blurred memory. One might remember having a packed event or an abundance of carrots and then go back to the data to find out that the event had low attendance or there weren’t all that many carrots. These contradictions provide additional valuable information; maybe, for example, it takes fewer people (or carrots) than expected to feel full and abundant.
At last year’s Sukkot Festival, for example, we had a pay what you can ticket option for the first time ($15 that would go towards the purchase of a produce distribution vehicle); and 75% of respondents to our survey shared that this felt like a meaningful way to contribute to the farm. Hearing that from attendees, we now are more confident to have a pay what you can ticket for our Jewish ag festivals.
Back to the parsha, what benefit might come from listing out each family within each tribe and listing the number of adult men? This census informed the division of the land of Canaan, a set of property boundaries that might have been the lines that were restored each Jubilee year. By listing out all of this data, instead of just saying how many total adult men there were or the number of families per tribe, allows for a multitude of questions, interpretations and conclusions. At any Jubilee year, some people might look at the redistribution of land and question why certain small families have more land than large ones, or why some families are clumped together. By looking at the family size at this census, these people could gain perspective on the land divisions. Similarly, the list of names may have proven useful to understanding whose ancestors were related to whose, which would help explain the grouping of families.
By keeping track of different factors and then keeping that raw data, instead of just an analysis of it, an organization is equipped to ask questions aimed to better understand its history and growth. This is especially useful in answering questions that nobody collecting that data years back would have thought of. For example, tracking age of participants is useful in the short term to understand what age demographic attended an event. It can also be useful in five years, when the organization wants to track demographic changes in event attendees.
Whether one is monitoring crops, attendance at festivals, sales, local phenology, or meeting lengths, the complement of quantitative and quantitative data paints a more accurate picture of reality, a helpful tool for an organization that focuses on specific goals and that is always trying to improve.
Jaclyn Kellner is the Coastal Roots Farm’s Jewish Farm Educator where she is responsible for Jewish and other educational programming. Prior to joining Coastal Roots Farm, Jaclyn taught residential Outdoor Education to 4th through 6th graders in Calabasas and Livermore, California. Jaclyn is also the Director of Education at Amir where she is updating and enhancing their summer camp farm and garden curriculum. Jaclyn graduated Brandeis University in 2015 with a degree in Environmental Studies. She enjoys spending as much time as possible outdoors getting really excited about things and then getting other people excited about them as well.
Editor’s Note: Welcome to D’varim HaMakom: The JOFEE Fellows Blog! Most weeks throughout the year, you’ll be hearing from the JOFEE Fellows: reflections on their experiences, successful programs they’ve planned and implemented, gleanings from the field, and connections to the weekly Torah portion and what they’ve learned from their experiences with place in their host communities for the year. Views expressed are the author’s and do not necessarily represent Hazon. Be sure to check back weekly!